Tuesday, June 20, 2023, 4:30 p.m. – I had just exited a 90-minute online knowledge-sharing session with fellow Global Power System Transformation Consortium (G-PST) system operators in the U.S., Australia, and Europe discussing best practices for managing transmission constraints in a system with high levels of inverter-based resources (IBRs) like wind and solar generation. Upon closing out of the meeting, my eyes immediately shifted focus to a monitor in my office displaying a dashboard of critical real-time Electric Reliability Council of Texas (ERCOT) system information, essentially a summarized version of the displays that operators in the control room down the hall use to monitor the ERCOT electric grid. As Director of Operations Planning, my role at ERCOT is to manage the planning team which acts as a support function to the control room, and in this real-time moment there was little support I could offer. But what unfolded that day provided me with valuable insights into ERCOT’s changing operations that has continued to inform my role in planning.

Figure 1: ERCOT LMP Energy Pricing Map on June 20, 2023
Operating with Uncertainty in Load and Generation
The day-ahead forecast showed demand exceeding 80,000 MW for the second time in ERCOT’s history – the first time being eleven months prior on July 22, 2022 – so there was excitement amongst everyone in ERCOT Operations, at least as excited as engineers get anyway. The forecasts for wind and solar generation indicated that, along with thermal generation, we would have enough supply to meet peak demand, which would occur around 5:00 p.m., though reserves were expected to be tight as solar generation declined corresponding to the sun setting.
During the G-PST session, I noticed that the pricing map on my dashboard turned red, a sign that wholesale prices were high, and the system was near scarcity conditions. With the session over, I started diving into the details to get a better feel for what was happening. System prices were $4,773/MWh, near the cap of $5,000, which is a relatively high cap compared to other regions – somewhat a function of ERCOT’s energy-only market.
Load was 79,226 MW, and likely near the peak given this was the hottest part of the day. Temperatures in Houston and Dallas – our two largest load centers – were both 97⁰F, which was slightly below forecast and likely a contributor to the load being less than the 82,400 MW forecast from a day ahead.
One factor causing the actual load to be less than forecast was demand response. This demand response is not due to programs administered by ERCOT, but by individual large consumers and retail suppliers. This demand response has not historically been included in operational forecasts. However, what used to be a demand response of 1,000 to 2,000 MW due to high system price has dramatically grown, and at times can exceed 5,000 MW. Because of this, ERCOT has initiatives underway to forecast this response, including the use of artificial intelligence, but in the summer of 2023, the methods were not yet ready to use in the control room.
The bulk of demand response in ERCOT comes from financial incentives for industrial consumers to reduce usage at certain times. Industrial demand comprises about 21% of ERCOT’s summer peak demand. Financial incentives include minimizing transmission charges based on the transmission cost allocation formulas and minimizing energy prices when exposed to wholesale prices. This can trigger a response when prices range from below several hundred dollars per MWh for crypto-mining data centers to several thousand dollars for large manufacturing plants or steel mills, depending on profitability threshold. With prices at nearly $5,000, almost all industrial users with the sophistication and ability to reduce consumption were likely doing so that June afternoon.
Crypto-mining data centers are categorized as “large flexible loads,” and before 2022, were almost non-existent on the ERCOT system. On June 20, 2023, these loads were consuming 1,800 MW earlier in the day, but with demand response incentives, were consuming just 400 MW at 4:30 P.M., a reduction of 78%.
On the supply side, thermal generator (nuclear, coal, and gas) outages totaled 8,679 MW, which was on the high side but still within the normal range for that time of year. However, the solar and wind generation and battery storage displays were what I found most interesting, as this would be the first summer that ERCOT was reliant on some level of renewable generation given that peak load exceeded the total capacity of the thermal fleet.
Solar generation at 11,381 MW was supplying 15% of system demand but started to ramp down for the evening on sunset. Somewhat concerning was the wind generation, which at 4,720 MW, was nearly 1,800 MW less than the day-ahead forecast and just 12.5% of the 37,702 MW of installed capacity. The forecast showed that coastal wind should be starting to pick up during sunset, which should have somewhat offset the reduction in solar generation, but that had not happened. Physical responsive capability (PRC), a measure of readily available online reserves, was 4,876 MW, a relatively healthy and reliable margin. Additionally, batteries were discharging 613 MW and still had 2,934 MWh of energy remaining.
5:00 p.m.
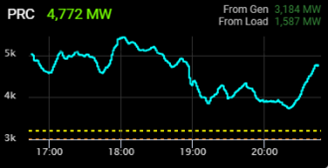
Load was 79,333 MW, but had peaked a few minutes earlier and was slowly starting to decrease. A few years earlier, this would have been the time when the engineers would go home because once you had made it past the 5:00 p.m. peak hour you were fairly confident that there would be no more excitement for the day. But the system on that day was not like it was a few years ago. Solar had decreased to 10,780 MW with the sunset ramp down, but wind was still at 4,762 MW. The forecasted wind ramp up had not yet started. Batteries were contributing 729 MW with 2,647 MWh of stored energy. PRC had dropped slightly to 4,612 MW, still a reliable number, but directionally not ideal. With this information, I texted my wife to let her know that I would be home later that evening.
5:30 p.m.
Wind had started to ramp up (5,012 MW), but that was more than 2,000 MW below the day-ahead forecast. Part of my team’s responsibility is to calculate the reserve capacity quantities that we procure through ancillary services, which the operators were using on this day to make up for wind shortfall compared to forecast, and I reminded myself that this was exactly why we buy these services – to handle unexpected situations with grid reliability as the primary focus.
7:10 p.m.
Load had dropped to 76,199 MW, and wind generation sat at 6,660 MW and was climbing. But prices had increased to $5,000, and solar had ramped down to 5,326 MW. Batteries still had 2,561 MWh of stored energy, and PRC was lower but still above 4,000 MW. Curiously, some of the large flexible loads had begun to increase consumption again despite the high prices. I walked down the hall to ask colleagues’ thoughts on whether batteries would run out of energy once the sun set and the solar dropped off. They informed me that a few batteries had run out but were confident that there was enough energy to operate the grid reliably.

Figure 2: ERCOT Load, Wind and Solar on June 20, 2023
8:45 p.m.
Solar had nearly completely ramped down, to 28 MW, but load had also dropped to 72,294 MW and wind had risen to 8,742 MW. About 10 minutes earlier, battery state of charge bottomed out at 1,223 MWh, but with the system past the net peak time, batteries began charging up rather than discharging. PRC had climbed to 4,772 MW. The grid was operating under normal conditions, and with that, I was comfortable to leave the office for the day.

Figure 3: ERCOT Physical Responsive Capability (PRC) on June 20, 2023
Thoughts as I Walked to my Car at 9:00 p.m.
As I was walking to my car, I was somewhat disappointed that we did not reach 80,000 MW of demand. However, this disappointment was short-lived as we crossed that threshold just one week later. In fact, demand exceeded 80,000 MW on a total of 49 days by the end of September 2023, with a new all-time peak demand record of 85,508 MW on August 10 – an incredible accomplishment considering that the all-time peak demand prior to 2022 was just 74,800 MW. Texas continued to experience significant economic and population growth and with this growth, demand on the grid increased. Demand response and batteries were both small, but meaningful contributors to our ability to meet this challenge, but we still have more to learn as their contributions grow.
I realized that this was exactly the type of day we envisioned years prior when we talked about the energy transition. We reliably made it through that June day when we were dependent on wind and solar generation. Each source presented its own challenges, but we used the tools we had planned to use to meet those challenges. Later, I would hear from the operators about the stress these challenges cause them. This is a reminder that as the transition continues and we face increased and new challenges, we need to continue to innovate to provide the operators the tools they need to reliably meet those challenges.
Jeff Billo
Director, Operations Planning
Electric Reliability Council of Texas


Welcome to the “New World”. Operations needs better forecasting tools, more flexible resources and, more storage.
Mr. Billo,
Your article vividly captures the intricate and dynamic nature of managing ERCOT’s grid amidst evolving energy demands and generation patterns. The insights you’ve shared, particularly around the integration of renewable resources and the strategic deployment of demand response, illuminate the challenges and the strides made toward a more resilient and sustainable energy system. Your day not only underscores the importance of innovative forecasting and operational strategies but also highlights the critical role that system operators play in ensuring reliability in real time. As ERCOT continues to navigate this complex landscape, your experiences and reflections provide invaluable guidance for the energy sector’s ongoing transformation. Thank you for sharing your perspective and contributing to the broader conversation about our energy future.