Author: Sandia National Laboratories[1]
This document provides an empirically based performance model for grid-connected photovoltaic inverters used for system performance (energy) modeling and for continuous monitoring of inverter performance during system operation. The versatility and accuracy of the model were validated for a variety of both residential and commercial size inverters. Default parameters for the model can be obtained from manufacturers’ specification sheets, and the accuracy of the model can be further refined using measurements from either well-instrumented field measurements in operational systems or using detailed measurements from a recognized testing laboratory. An initial database of inverter performance parameters was developed based on measurements conducted at Sandia National Laboratories and at laboratories supporting the solar programs of the California Energy Commission
Contents
Introduction
This document provides a description and demonstrations of a versatile performance model for the power inverters used in photovoltaic (PV) systems. These inverters convert the direct current (dc) power provided by an array of PV modules to alternating current (ac) power compatible with the utility power grid. The inverter performance model can be used in conjunction with a photovoltaic array performance model[2][3][4] to calculate expected system performance (energy production), to verify compatibility of inverter and PV array electrical characteristics, and to continuously monitor inverter performance characteristics that may indicate the need for repair or maintenance.
A primary objective of this effort was to develop an inverter performance model applicable to all commercial inverters used in photovoltaic power systems, providing a versatile numerical algorithm that accurately relates the inverter’s ac-power output to the dc-power input. The model developed requires a set of measured performance parameters (coefficients). The complexity and the accuracy of the performance model are “progressive” in the sense that the accuracy of the model can be improved in steps, as more detailed test data are available. Manufacturers’ specification sheets provide initial performance parameters, field measurements during system operation provide additional parameters and accuracy, and detailed performance measurements as conducted by recognized testing laboratories[5][6] provide further refinement of parameters used in the model. The inverter performance model presented does not provide an electrical engineering model of circuit characteristics or power conditioning algorithms used in the development of new inverter designs[7]; rather it is an empirical, or phenomenological, model that simply but accurately replicates the power delivery characteristics of the dc- to ac-inversion process.
The modeling approach used was similar to that often used in “design of experiments” analyses, where the non-linear response of a complex system or process can be modeled as the interaction of several factors, each factor typically having a linear relationship with an independent variable or variables. The understandability of the inverter performance model was improved through an algebraic construction where factors in the model have easily understood physical significance.
Description of Inverter Performance Model
Manufacturers’ specification sheets contain a variety of information essential to the successful application of a PV inverter, including ac voltage, ac frequency, maximum ac power and current, acceptable dc voltage range, maximum dc power and current, dc startup voltage, total harmonic distortion, power factor, and acceptable environmental extremes, as well as mechanical characteristics. However, the inverter’s “power conversion performance” or efficiency is often provided as a single peak efficiency value, which can be misleading, and sometimes as a “California Energy Commission (CEC) weighted” efficiency value. Regardless, PV system engineers and analysts would benefit from more detailed performance characteristics.
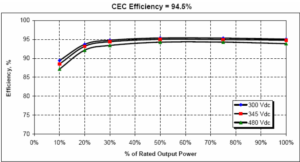
Independent testing laboratories now provide more detailed inverter performance data, notably those laboratories supporting the solar power initiatives of the CEC[8]. These laboratories typically use an inverter testing methodology based on the protocol collaboratively developed by Sandia National Laboratories and BEW[9]. The objective of the CEC testing protocol is to verify inverter performance specifications, as well as to quantify performance characteristics as a function of power level and dc input voltage, the two parameters determined by laboratory evaluations to have the most significant impact on efficiency. The inverter test data documented by the CEC[5] are thorough, providing measurements at six power levels and three different dc voltage levels. Five to seven replicate measurements at each condition provide good statistical rigor. Figure on the right illustrates an example of inverter performance data documented by the CEC, providing inverter efficiency (ac-power divided by dc-power) as a function of the ac-power output of the inverter, at three different dc voltage levels. Our effort, documented in this report, shows that by presenting the CEC test data differently, additional information can be obtained that is more directly applicable in modeling PV system energy production. Later in this document, several examples will more clearly illustrate the alternative procedure for extracting more information from the CEC data.
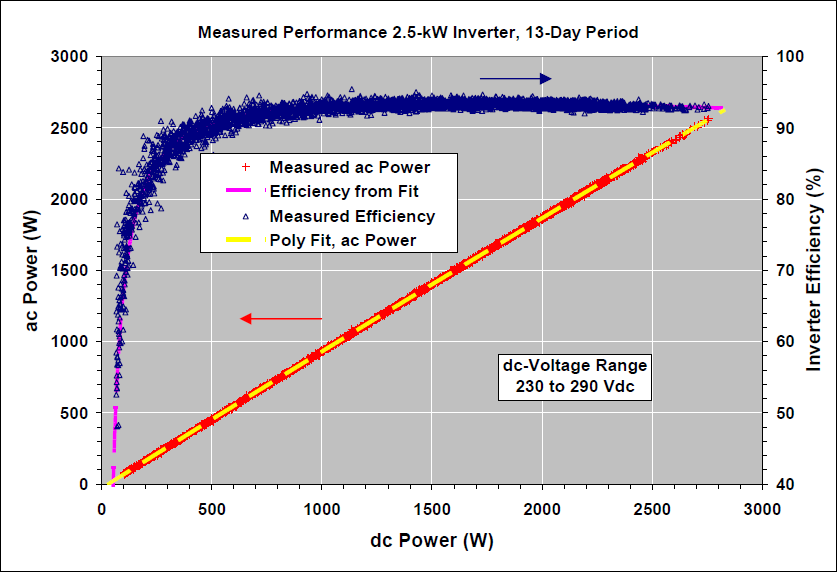
The initial concept for the new inverter performance model provided in this document resulted from analysis of system performance data recorded in Sandia’s PV System Optimization Laboratory[3]. Fully instrumented PV systems provided the opportunity to analyze performance of both the PV array and the inverter based on daylong energy production for many days with a wide variety of operating (environmental) conditions. These “field” data provided hundreds of measurements at different power levels, from startup to levels exceeding the inverter’s peak power rating, but the range for dc voltage was relatively limited and not easily controlled compared to the CEC laboratory testing approach. The advantages of the “field testing” approach for acquiring inverter performance data are that recorded data are completely representative of actual system operating conditions, and free from possible electronic interactions that might occur between an inverter and test equipment (power supplies) in the laboratory. Figure on the right illustrates a “field test” example with thousands of measurements recorded over a 13-day period.
The characteristic perhaps most evident in the “Inverter performance measurements conducted by a nationally recognized testing laboratory and documented by the CEC” figure is the well-behaved nature of the relationship between measured ac-power and dc-power, over the full range of dc-input power for both rapidly changing cloudy conditions as well as clear sky conditions. The relationship between ac and dc power appears to be nearly linear. However, the power consumed by the inverter itself (self-consumption) as well as the electrical characteristics of inverter circuitry at different voltage and power levels result in differing degrees of non-linearity in the relationship between ac-power and dc-power. The measured inverter efficiency values (ac-power divided by dc-power), also shown in the “Inverter performance measurements conducted by a nationally recognized testing laboratory and documented by the CEC” figure, amplify the non-linearity inherent in the relationship between ac- and dc-power. Frequently in modeling PV system energy production, inverter efficiency is assumed to be a constant value, which is the same as assuming that inverter efficiency is linear over its operating range, which is clearly not the case. The scatter in the efficiency measurements resulted from a combination of variation in dc input voltage, inherent inverter behavior, rapidly varying solar irradiance, and measurement error. Again, the objective of our effort was to accurately model the relationship between ac-power and dc-power for all inverter types, over their full operating voltage and power range.
Stability and repeatability of inverter performance characteristics are a prerequisite both for reliable PV system performance, as well as for determining parameters used in the performance model. Similarly, the stability and repeatability of performance characteristics for PV arrays are a prerequisite for high-reliability PV systems. Therefore, when conducted in the laboratory, the inverter testing protocol must be accurate, repeatable, and not introduce electrical instabilities that are not representative of actual operation in a PV system. Additional discussion of instabilities introduced by test equipment are provided later in this report for specific inverter test results that are used to validate our inverter performance model.
It should be noted that the inverter’s maximum-power-point-tracking (MPPT) effectiveness was not explicitly included in our performance model for several reasons. First, the MPPT effectiveness of most inverters manufactured today is quite high, providing 98 to nearly 100% of the energy available from the PV array. Second, MPPT effectiveness is very difficult to measure because it requires simultaneous measurements of dc-power into the inverter and the maximum power point (Pmp) of the PV array. In most cases, the inverter is rapidly varying its operating voltage over a reasonably large range while “searching” for the array Pmp. To complicate the situation, the only way to measure the array Pmp accurately is to disconnect the inverter from the array and measure a current-voltage (I-V) curve, thus interrupting the MPPT process. Another procedure used to monitor an inverter’s MPPT characteristics involves using an accurate performance model for the PV array so that the measured dc-power into the inverter can be continuously compared to a predicted Pmp for the PV array[3]. Using the array performance model to continuously predict Pmp based on solar irradiance and array temperature measurements provides an effective way to observe the inverter’s MPPT characteristics, particularly during rapid variations in solar irradiance (clouds) where the MPPT algorithm must be versatile in order to “lock on” to a rapidly changing Pmp. However, due to the uncertainty in the PV array performance model (± 2% at best), the approach is not accurate enough to quantify MPPT effectiveness for high-performance inverters where the MPPT effectiveness is 98% or better. Therefore, instead of attempting to incorporate an inverter’s MPPT effectiveness in our model explicitly, the slight system energy loss related to MPPT can be better addressed as a simple multiplicative “derate factor” in system performance modeling.
Neither the inverter (heat sink) operating temperature nor the ambient temperature were explicitly included in our performance model, for two reasons. Current inverters that are laboratory tested and listed as eligible for CEC recognized applications in California are tested at different ambient temperatures (25 and 40 ºC), and their efficiencies typically do not have a strong temperature dependence, as evidenced in test results presented later in this document. In actual applications, inverters are mounted in a wide variety of locations and orientations (in garages, on external walls, in the sun, in the shade) and as a result, it is impractical to attempt to model inverter operating temperature as a function of environmental conditions. Therefore, if laboratory tests verify that inverter performance is stable at its maximum specified ambient temperature, and if the inverter is mounted according to the manufacturer’s specifications, then it is not necessary to include inverter temperature in the performance model.
Basic Equations

Figure on the right graphically illustrates our inverter performance model, with performance characteristics exaggerated in order to illustrate the physical significance of the parameters used in the model. The basic equations describing the model and the definition of all parameters follow.
The following equations define the model used to relate the inverter’s ac-power output to both the dc-power and the dc-voltage, which were used as the independent variables. The parameters with the “o” subscript are constant values that define a reference or nominal operating condition.
\(P_{ac} = \left (\cfrac{P_{aco}}{A-B}-C\cdot(A-B)\right )\cdot(P_{dc}-B)+C\cdot (P_{dc}-B)^2\)where
\(A = P_{dco}\cdot\left (1+C_1\cdot(V_{dc}-V_{dco})\right )\) \(B = P_{so}\cdot\left (1+C_2\cdot(V_{dc}-V_{dco})\right )\) \(C = C_{o}\cdot\left (1+C_3\cdot(V_{dc}-V_{dco})\right )\)
Performance Parameter Definitions
Pac = ac-power output from inverter based on input power and voltage, (W)
Pdc = dc-power input to inverter, typically assumed to be equal to the PV array maximum power, (W)
Vd = dc-voltage input, typically assumed to be equal to the PV array maximum power voltage, (V)
Paco = maximum ac-power “rating” for inverter at reference or nominal operating condition, assumed to be an upper limit value, (W)
Pdco = dc-power level at which the ac-power rating is achieved at the reference operating condition, (W)
Vdco = dc-voltage level at which the ac-power rating is achieved at the reference operating condition, (V)
Pso = dc-power required to start the inversion process, or self-consumption by inverter, strongly influences inverter efficiency at low power levels, (W)
Pnt = ac-power consumed by inverter at night (night tare) to maintain circuitry required to sense PV array voltage, (W)
Co = parameter defining the curvature (parabolic) of the relationship between ac-power and dc-power at the reference operating condition, default value of zero gives a linear relationship, (1/W)
C1 = empirical coefficient allowing Pdco to vary linearly with dc-voltage input, default value is zero, (1/V)
C2 = empirical coefficient allowing Pso to vary linearly with dc-voltage input, default value is zero, (1/V)
C3 = empirical coefficient allowing Co to vary linearly with dc-voltage input, default value is zero, (1/V)
Determination of Inverter Performance Parameters
The accuracy and versatility of the inverter performance model depends on the data available for determining the performance parameters used in the model. We structure our model to make it possible to add parameters successively, improving accuracy, as more detailed test data are available. Initial (default) parameters can be obtained from manufacturer specification sheets. If available, daylong ac-power and dc-power measurements from operating systems provide additional parameters and improved accuracy. Finally, detailed laboratory measurements, like those conducted by nationally recognized testing laboratories for the CEC[5], can be used to obtain all performance parameters currently included in the model. During the validation of our performance model, an initial database of inverter parameters was generated and is given here. Using the methods described in this document, field measurements or tabulated performance data provided by recognized laboratories provide the means for adding parameters for new inverters to the database.
Manufacturer Specification Sheets
The terminology used and the performance parameters available from manufacturers’ specification sheets vary greatly. However, it is usually possible to determine reasonable estimates for the three parameters needed to provide a simple linear model for inverter performance (Paco, Pdco, Pso), with no dependence on dc-voltage input. The rated ac-power (Paco) is usually specified, as is the peak and/or CEC weighted efficiency. Dividing Paco by the efficiency value provides a value for the associated dc-power level (Pdco). The dc-power required to start the inversion process (Pso) may not be given in the specification, and should not be confused with the nighttime ac-power consumption (Pnt). Lacking a specification, a reasonable estimate for Pso is 1% of the inverter’s rated power. Field and laboratory test data have indicated that the startup or self-consumption power, as used in our model, is typically larger than the power level sometimes referred to as “standby” power or “consumption during operation.”
Field Performance Measurements
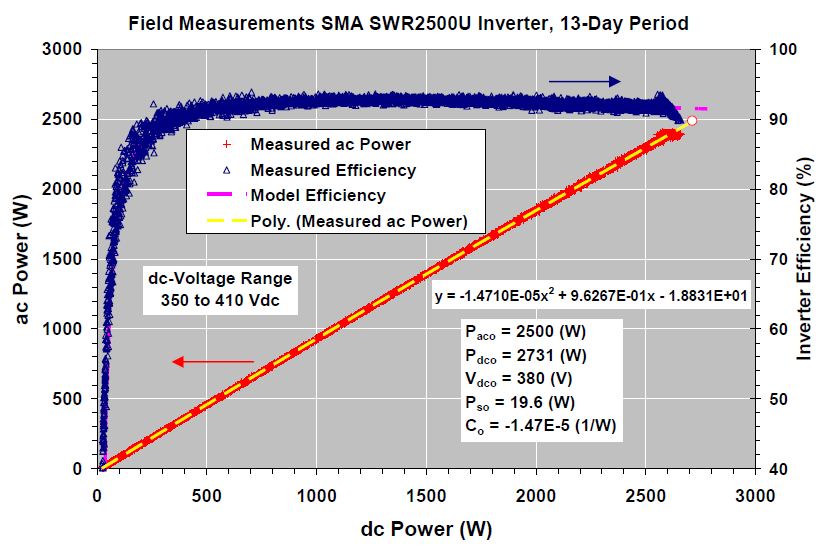
When accurate daylong measurements of both dc-power input and true ac-power (not volt-amps, VA) from the inverter are available, then additional performance parameters can be determined, providing improved accuracy for the inverter performance model relative to the simple linear model. The ““Field test” results for a SMA SWR-2500U inverter” figure illustrates field measurements of true ac-power, dc-power, and inverter efficiency over a 13-day period including both clear and cloudy weather conditions. The data values recorded were near instantaneous measurements, as opposed to average values determined over a time interval. The associated dc-voltage was also recorded during the field measurements. A parabolic fit (2nd order polynomial) to the measured ac-power versus dc-power provided parameters (Pdco, Pso, Co) used in the performance model. Paco was assumed equal to the manufacturer’s peak ac-power rating. The quadratic formula was used to solve for both the x-intercept (Pso) when Pac = 0 and for Pdco when Pac = Paco (2500 W in this case). A chart of measured dc-voltage versus measured dc-power over the 13-day period was used to obtain an estimate for the Vdco associated with the peak power condition at Pdco, Paco. Good day-to-day repeatability in performance characteristics has been observed for a variety of inverters during field testing at Sandia; therefore, it is likely that measurements recorded over a single day would provide inverter performance parameters that are representative of expected behavior.
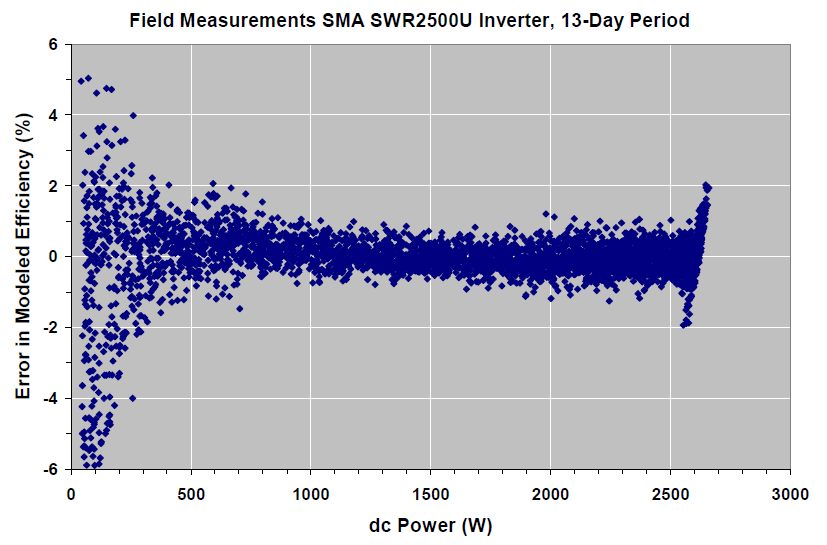
The error in the inverter performance model for field measurements was evaluated by calculating the percentage difference between the modeled and measured efficiency and plotting this difference as a function of the measured dc-power. The “Calculated errors between modeled inverter efficiency and measured efficiency based on field test data” figure shows the calculated error in the inverter efficiency model for the inverter data shown in the ““Field test” results for a SMA SWR-2500U inverter” figure. Note that the error was well distributed about zero, and that for the majority of the power range the error was within ± 1%. Thus, an inverter with a modeled efficiency of 92% would have an uncertainty of about ± 0.9%. The larger error at the peak power level occurred when the inverter was operating at its peak dcpower limit. The large error (scatter) at low power levels occurred as inverter efficiency rapidly dropped and was due to both measurement error and limitations in the model. The accuracy obtained using “field” measurements can be improved using laboratory measurements and a slightly more complex model, as will be discussed next. Nonetheless, the inverter model, with performance coefficients derived from field measurements during PV system operation, provides a very straightforward method for modeling inverter performance, and it provides a good method for monitoring inverter behavior as the system ages.
Laboratory Performance Measurements
_used_to_determine_C2_coefficient_and_value_for_Pso.png)
The example shown in the “Inverter performance measurements conducted by nationally recognized testing laboratory for the CEC” figure illustrates laboratory measurements available on the CEC website “List of Eligible Inverters”[5]. In this case, the inverter had a reasonably large operational range for dc-voltage input; as a result, the inverter efficiency varied noticeably, being higher at low dc-voltage input.
The CEC test protocol provides inverter performance (efficiency) measurements at six different power levels (10%, 20%, 30%, 50%, 75%, and 100% of ac-power rating) and three different input voltage levels (Vmin, Vnom, Vmax). The mid-range dc voltage, Vnom, defined by the CEC protocol (selected by the manufacturer at any point between Vmin+0.25*(Vmax-Vmin) and Vmin+0.75*(Vmax-Vmin)), was used as the reference voltage, Vdco, in the inverter performance model. The CEC measurement procedure provides five to seven replicated measurements at each test condition, providing good statistical rigor. The primary limitation of the CEC procedure was that measurements were performed for a single inverter of each type; the inverter may or may not be representative of the “typical” inverter off the production line.
All the performance parameters required in the more complex inverter model, defined in equations (1)-(4), can be determined using the CEC test data. The procedure for determining performance parameters from the tabulated CEC data is the same as previously discussed for the case using field measurements. The distinction is that data at each of the three dc-voltage levels were treated separately, allowing three of the parameters (Pdco, Pso, Co) to be expressed as a linear function of the dc-voltage, Vdc, as indicated in equations (2)-(4). Three separate parabolic fits were used, one for each set of ac-power versus dc-power measurements recorded at a near constant dc-voltage level. During analysis, the tabulated CEC test data were first combined using all replicate measurements, and then sorted by ascending dc voltage to combine measurements for each of the three common dc-voltage levels. The mid-voltage data, Vnom, provided the “reference” operating condition.
In order to determine the coefficients C1, C2, and C3, the values for Pdco, Pso, and Co determined from the three separate parabolic fits were used to calculate the dc-voltage dependence for each factor. For instance, the “Linear regression (trend line)” figure shows the linear fit used to determine the coefficient C2, as well as the value for Pso at the Vnom reference voltage. The data for this inverter, as well as several others investigated, suggested that the dc-power required to start the inversion process was somewhat lower at the low dc-voltage level, consistent with achieving higher inverter efficiency at low dc-voltage levels. The same analytical procedure (linear fit) was used to determine C1, Pdco, and C3, Co at the Vnom reference voltage.
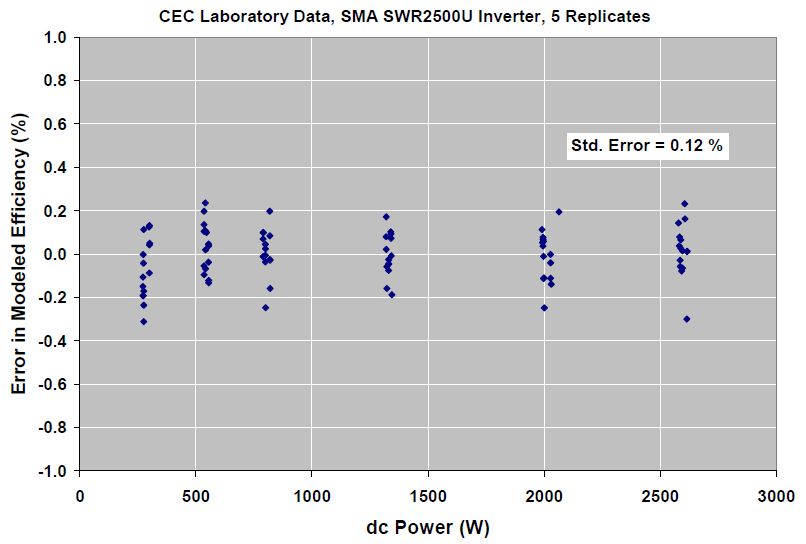
The added complexity in the inverter performance model, resulting from including voltage dependence for three factors, significantly reduced the error associated with the modeled inverter efficiency. The “Calculated errors between modeled inverter efficiency and measured efficiency” figure shows that the calculated error between the modeled and the measured inverter efficiency was reduced to less than ± 0.2% when all parameters were included in the model. This result was encouraging because the inverter model is actually rather simple, and it is straightforward to determine the required performance parameters. Additional analysis was conducted to verify that the model worked equally well for inverters from a variety of manufacturers.
Validation of Inverter Performance Model
The data quality and the large variety of inverter types included in the tabulated CEC test results provided an ideal opportunity for validating our inverter performance model. The CEC website includes measured performance data for inverters from many different manufacturers, as well as for both low (~2.5-kW) and high capacity (~225-kW) inverters. Analysis and determination of performance parameters for a variety of inverters with subsequent analysis of modeling errors was used to validate our performance model.
Typical Laboratory Test Results
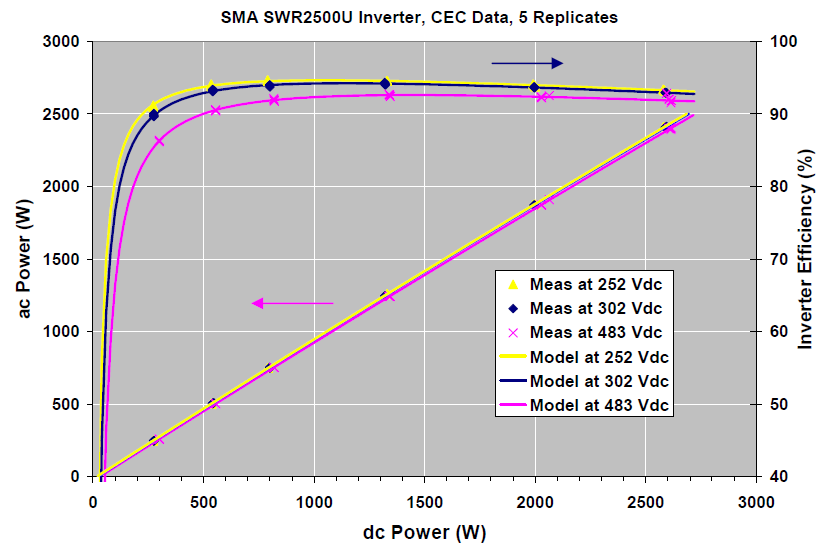
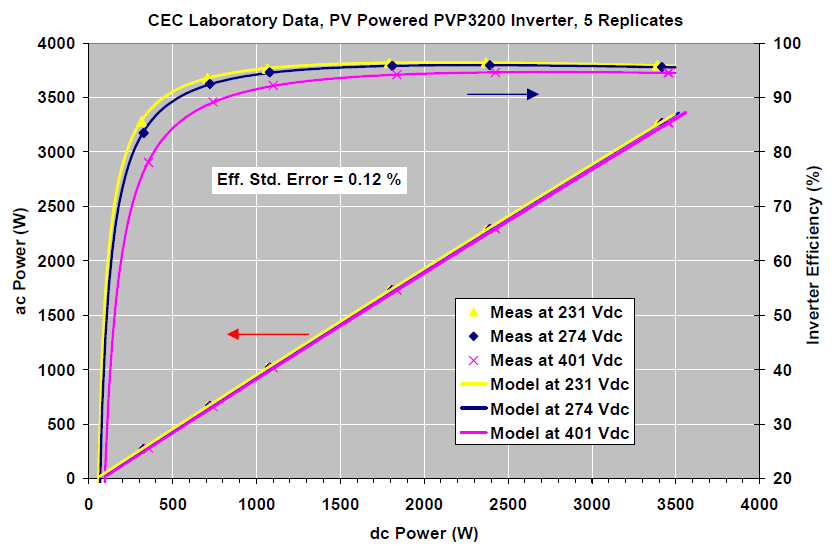
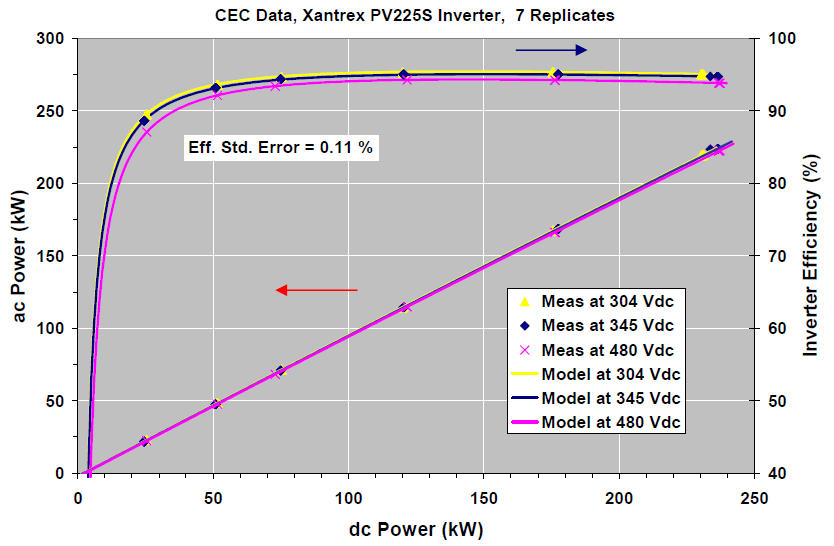
The “Comparison of measured versus Sandia performance model using CEC laboratory test data for the Xantrex GT3.8 inverter at six power levels and three dc-voltage levels” and “Comparison of measured versus Sandia performance model using CEC laboratory test data for the PV Powered PVP3200 inverter at six power levels and three dc-voltage levels” figures show CEC measured performance for two common residential-scale inverters, along with the Sandia performance model shown as solid lines through the measured data points. The performance parameters determined for these two inverters are provided in the inverter database in the appendix of this document. The performance model was very effective in fitting measured data for both these inverters with a standard error in measured versus modeled efficiency of about 0.1%. The model was equally effective for the commercial-scale 225-kW inverter shown in the “Comparison of measured versus Sandia performance model using CEC test data for the large 225-kW Xantrex PV225S inverter at six power levels and three dc-voltage levels” figure.
Anomalous Test Results

Performance models and test results are rarely perfect. Significant discrepancies between the model and measured values may occur for a variety of reasons: an inadequate model, errors in test measurements, irregular inverter behavior, or unexpected interactions between the inverter and the test equipment.
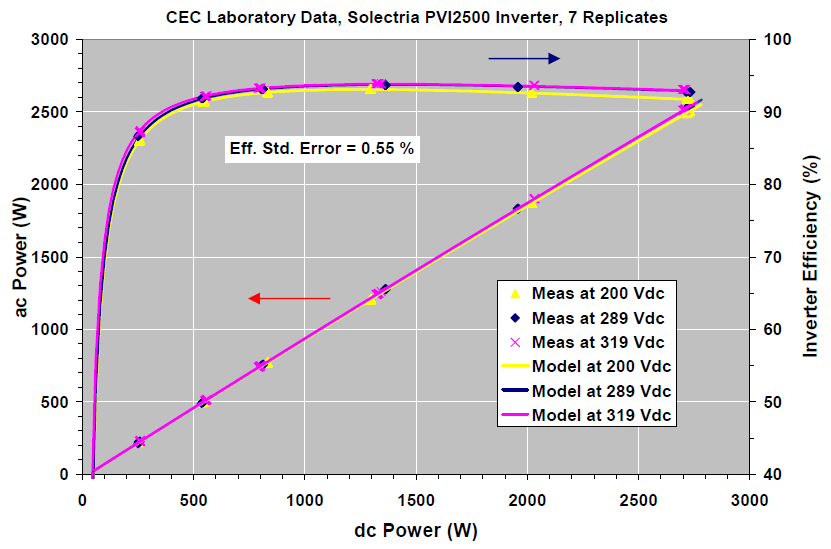
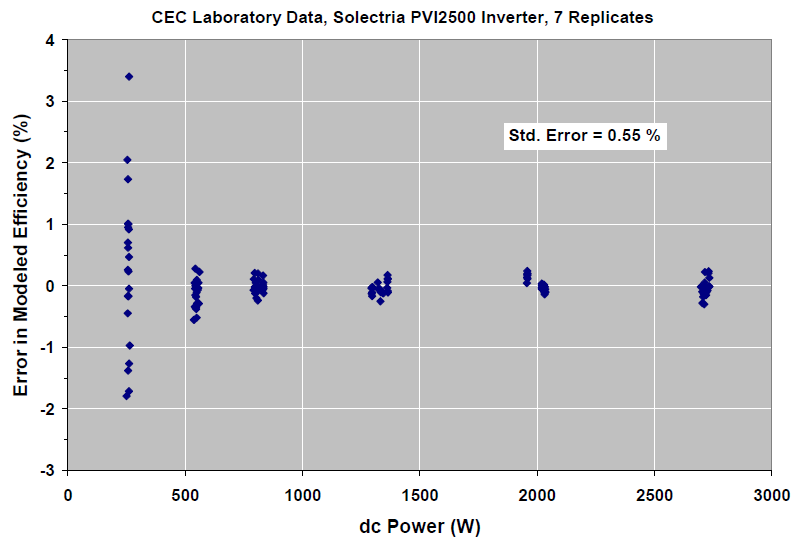
The “Measured versus model comparison using CEC laboratory test data for the Solectria PVI2500 inverter at six power levels and three dc-voltage levels” and “Calculated errors between modeled and measured efficiency based on CEC laboratory test data for the Solectria PVI2500 inverter at six power levels and three dc-voltage levels. Relatively large errors resulted at the lowest power levels only” figures show an example of CEC test data where the standard error for all measurements was reasonably good (0.55%); however, relatively large discrepancies (±3%) occurred between the measured and modeled efficiency at the lowest power level. This variability at the low power level was likely the result of instabilities introduced by the inverter test equipment. Note that this inverter was of the same type measured during field tests at Sandia, shown in the ““Field test” results for a 2.5-kW Solectria PVI2500 inverter recorded during system operation at Sandia” figure, where variability in the measured efficiency was much smaller at low power levels.
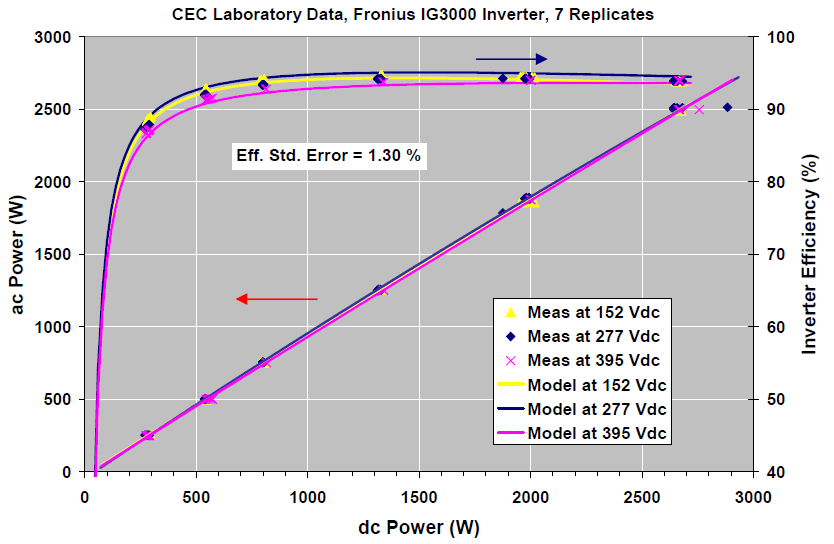
The “Measured versus model comparison using CEC laboratory test data for the Fronius IG3000 inverter at six power levels and three dc-voltage levels” and “Calculated errors between modeled and measured efficiency based on CEC laboratory test data for the Fronius IG3000 inverter at six power levels and three dc-voltage levels. Relatively large standard error resulted at multiple power levels due to lack of repeatability” figures illustrate CEC test data where relatively large discrepancies between measured and modeled efficiency occurred at all power levels. In this case, the variability was due to inherent instability in the inverter itself because the replicate measurements were not repeatable.
System Performance Analyses
The inverter performance model presented in this document improves the accuracy and versatility of models used for designing PV systems; in particular, assessments of ac energy production are more accurate. The performance model, along with additional parameters included in the inverter database, provides the information needed to ensure compatibility and optimum performance of arrays and inverters. The inverter model also makes it possible to monitor the long-term performance and aging characteristics of both inverters and systems with accuracy previously unavailable.
Coupling with Array Performance Model
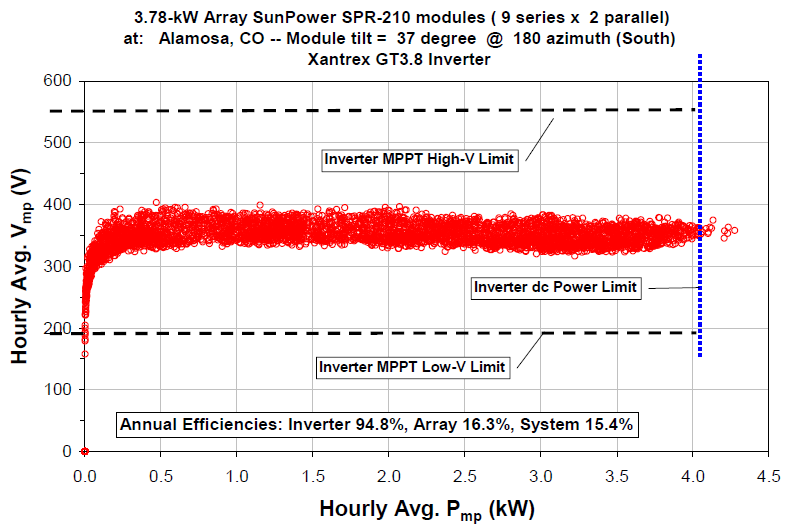
PV array performance models such as that previously documented by Sandia[2], and also implemented in commercial PV system design software[4], can now be coupled with an accurate and well-validated inverter performance model. The combination provides a versatile tool for designing PV systems, studying sensitivity of ac-energy production to different module and inverter combinations, verifying inverter parameter limits are not exceeded, and ensuring optimum array utilization. In order to make best use of the inverter model and associated database of performance parameters, the PV array performance model must provide calculated values for array open-circuit voltage (Voc), maximum-power voltage (Vmp), maximum-power current (Imp), as well as maximum power (Pmp). The Vmp and Pmp values are used directly in the inverter performance model to determine ac-power production. By using hourly solar resource and weather data in the PV array performance model, several system design criteria can be evaluated. The calculated values for Voc, Vmp, Imp, and Pmp should be used to verify that the array Voc does not exceed the inverter’s maximum dc voltage (Vdcmax), the array Imp does not exceed the inverter’s maximum dc current (Idcmax), and that the calculated Pmp rarely exceeds the inverter’s peak dc power rating (Pdco).
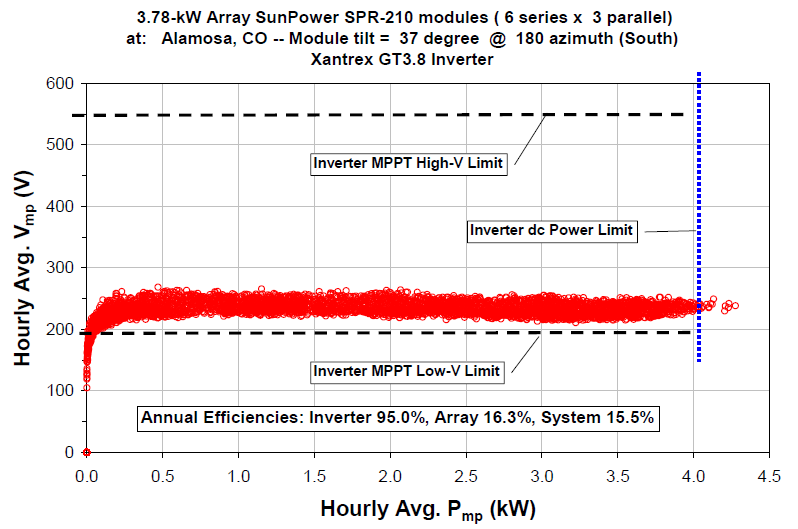
As an example, the “System annual performance analysis with combined array and inverter performance models” figure illustrates an optimized system design for a 3.78-kW array of SunPower SPR210 modules (6 series by 3 parallel configuration) coupled with a Xantrex GT3.8 inverter, and optimized for highest performance in the solar resource and weather conditions in Alamosa, Colorado. Inverter efficiency is highest for dc voltages near the low MPPT limit and for array maximum power that only occasionally exceeds the inverter’s upper dc-power limit, resulting in an overall annual system ac efficiency of 15.5%. However, most system designers would opt to design the system a little more conservatively (9 series by 2 parallel configuration), which raises the system voltage and gives more margin for wiring losses and long-term module performance degradation, as illustrated in the “System annual performance analysis using array and inverter performance models, more conservative system design providing extra margin for degradation in array voltage” figure. The efficiency of the Xantrex GT3.8 inverter was relatively insensitive to the dc-voltage level, so the impact on the more conservative design on annual system efficiency was minor, dropping to 15.4%. The point of this discussion is that coupling an array performance model with the inverter performance model improves the ability to design and optimize PV systems based on annual ac energy production.
Inverter Performance Monitoring
The inverter performance model provides a new opportunity for accurately monitoring the performance and health of the inverter, in real time. Inverter monitoring can be accomplished by using a data acquisition system providing periodic measurements of dc voltage and power, as well as true ac power. In real time, inverter efficiency can be calculated and compared to the inverter efficiency determined using the inverter performance model. Deviations between measured and calculated inverter efficiency would provide direct evidence of inverter malfunction or degradation in performance. It is likely, given experience, that the nature of the deviations would provide the diagnostic information needed to define required inverter maintenance.
Advanced inverter designs should have the inverter model incorporated in firmware, and should be equipped with accurate dc and ac power meters, as well as standardized communication protocol. These advanced features would provide direct inverter performance monitoring capability, help reduce the installation cost of PV systems, and facilitate expedient and cost-effective field maintenance. Conceivably the PV array performance model could also be incorporated in the inverter’s firmware providing system monitoring and diagnostic functions for the entire system.
Conclusions
An empirically based inverter performance model has been developed and validated, using both field and laboratory measurements, for a variety of inverter sizes, designs, and manufacturers. The accuracy of the model, for inverters with stable and repeatable performance, has proven to be more than adequate for PV system performance modeling purposes. Based on well-controlled laboratory measurements, the standard error obtained between measured and modeled inverter efficiency was typically about 0.1%. The inverter model, particularly when coupled with an accurate array performance model, provides significant improvements in the ability to analyze PV system performance, monitor inverter and array performance, and diagnose causes of system performance degradation.
References
- ↑ Sandia, Performance Model for Grid-Connected Photovoltaic Inverters, September 2007, [Online]. Available: http://prod.sandia.gov/techlib/access-control.cgi/2007/075036.pdf. [Accessed April 2014].
- ↑ 2.0 2.1 D. L. King, W. E. Boyson, and J. A. Kratochvil, Photovoltaic Array Performance Model, Sandia National Laboratories Report, SAND2004-3535, August 2004. http://www.sandia.gov/pv
- ↑ 3.0 3.1 3.2 D. L. King, G. M. Galbraith, W. E. Boyson, S. Gonzalez, A. T. Murray, J. W. Ginn, and W. I. Bower, Array Performance Characterization and Modeling for Real-Time Performance Analysis of Photovoltaic Systems, 4th World Conference on PV Energy Conversion, Hawaii, May 2006
- ↑ 4.0 4.1 Maui Solar Energy Software Corporation, Solar Design Studio Ver. 6.0: PV-DesignPro and IVTracer, http://www.mauisolarsoftware.com
- ↑ 5.0 5.1 5.2 5.3 Guidebook for Emerging Renewables Program, California Energy Commission, 8th Edition, December 2006, http://www.energy.ca.gov/2006publications/CEC-300-2006-001/CEC-300-2006-001-ED8F.PDF
- ↑ H. Neuenstein and A. Schlumberger, PHOTON Puts On-Grid Inverters Through Their Paces, Photon International, January 2007
- ↑ Michael Ropp and Sigifredo Gonzalez, “Development of a MATLAB/Simulink Model of a Single-Phase Grid-Connected Photovoltaic System,”http://infoserve.sandia.gov/sand_doc/2007/073290p.pdf
- ↑ California Solar Initiative paper, http://www.cpuc.ca.gov/EFILE/RULINGS/63092.pdf
- ↑ W. Bower, M. Behnke, W. Erdman, and C. Whitaker, (BEW), “Performance Test Protocol for Evaluating Inverters Used in Grid-Connected Photovoltaic Systems,” available for download at http://www.bewengineering.com

